
Although, yum.
One of the recurring themes of the Something Interesting blog is that, in order to be taken seriously as THE science of behavior, behavior analysis must do more to make sense of things people do and experience in their everyday lives. We’re great at addressing a few types of problems, but we have ignored or only dabbled in a lot that is part of typical peoples’ milieu. In previous posts I’ve discussed cursing, “verbal fillers,” wild-animal control policies, Halloween-adjacent phemomena, “linguistic drift,” and political election trends, to cite just a few examples.
I’ve also pointed out why I’m not much into so-called conceptual analyses as a way of breaking down everyday behaviors. In brief, these narrative-style explorations are too subjective for my taste, and their conclusions aren’t necessarily testable. No, I believe the proper foundation of an analysis of everyday behavior is empirical data.
The present post originates in a rabbit hole I tumbled down on the day that’s affectionately called the baseball solstice. More on that in a moment, but let me assure you that this post isn’t about baseball per se, and that to proceed you need know only one thing about the sport: Its fans exhibit what clinicians call “restricted interests.” Baseball people watch a lot of baseball, talk a lot about baseball, monitor a dizzying array of baseball statistics, spend a lot of time reflecting on baseball history, and wear a lot of clothing displaying baseball team logos. [Q: How can you tell if someone likes baseball? A: No matter what the topic of conversation, they’ll tell you.]
We should expect nothing less from devotees of a sport that revels in its flirtation with ceaselessness. A baseball season plods along for more than seven months and encompasses roughly 2500 games. Each game lasts more than 2.5 hours on average (but may feel a lot longer to the non-enthusiast). In case you’re counting, that’s roughly 6500 hours of games annually, incorporating about 729,000 pitches and 165,000 or so at-bats. [Disclaimer: These numbers apply to Major League Baseball® in the U.S. and Canada. Your results may vary in other jurisdictions; see Postscript 1.]
Even after all of that baseball, a baseball fan goes into deep mourning, even dysthymia, when a season ends — perhaps unsurprising for an organism that seems immune to satiation of its preferred reinforcer (see Postscript 2).

And this is where the baseball solstice comes in: It’s the day that precisely bisects the period between the end of one baseball season and the start of another (as defined by the first game of a preparatory mini-season called Spring Training). In other words, it’s the moment when, for baseball zealots, mourning starts to give way to the hope and optimism and sense of renewal that comes with a new season, as John Fogerty expressed so joyfully in the song “Centerfield” (Baseball geeks: Check out Fogerty’s magnificent baseball-bat guitar).
In light of the baseball fan’s insatiable hunger for baseball information, I got to wondering how baseball-related activity on a search engine like Google — the richest source of information (good and bad) in the known universe — would look like in the run-up to a new season. The science of behavior may tell us something about what to expect.
Baseball’s Spring Training is a roughly month-long period of workouts and scrimmage games preceding the regular season that kicks off at about the same time every year (late February-ish). Between the October end of one season and the start of the next season’s Spring Training, people who hunger for baseball news encounter slim pickins’. Therefore Google searches related to baseball are on something close to an extinction schedule during this period. But with the start of Spring Training there’s suddenly a a bounty of riches: game scores and player statistics and player-injury reports and roster drama.
Operant research shows that when reinforcement is contingent on behavior, but only after a fixed period of time when no reinforcement is available, behavior, when plotted on a cumulative graph, tends to follow a repeating scalloped pattern. Each “scallop” stats with close to zero responding initially, giving way gradually to positively-accelerating rates up to the point when reinforcement occurs. In pure form (as can be arranged in the laboratory) the fixed-interval reinforcement schedule yields behavior like this.

Reproduced from Myers and Mesker (1960), Journal of the Experimental Analysis of Behavior. A horse was chosen as subject in this study to illustrate “the relative ease with which specific topological operants may be elicited and stabilized in different species.” The published report is mum on possible parallels between baseball fans and any aspect of horse anatomy.
Thinking that baseball news originating in Spring Training might be a reinforcer for web searching, I used Google Trends to examine the volume of Google searches originating in the U.S. for spring training, across the past 20 years (Full disclosure: As Postscript 3 explains, there are some real limitations to the data this tool provides).
The result: See below for a whole lotta scalloping. When I plotted these data (see Postscript 4), my Inner Voice, which relies too much on outdated Boomer idioms, shouted THAT IS SO COOL.
By the way, in case the similarity to FI performance isn’t sufficiently obvious, the inset shows an expanded view of roughly the past three years, with a downward slash added to show when each year’s Spring Training began.

These analyses are, unfortunately, pretty crude. The unit of time is months for the main graph and weeks for the inset. But web searches, just like responses in an operant chamber, happen in real time, so at least some of the reliable scalloping implied by the graphs could be simply an artifact of how the data are aggregated by Google Trends.
If what the graphs seem to show is for real, then we’d expect spring training searches to gradually increase, day by day, until the putative reinforcer (news that comes with the onset of Spring Training) is available. In the lab, after a reinforcer is earned, responding quickly resets to a near-zero level to start a new scallop.
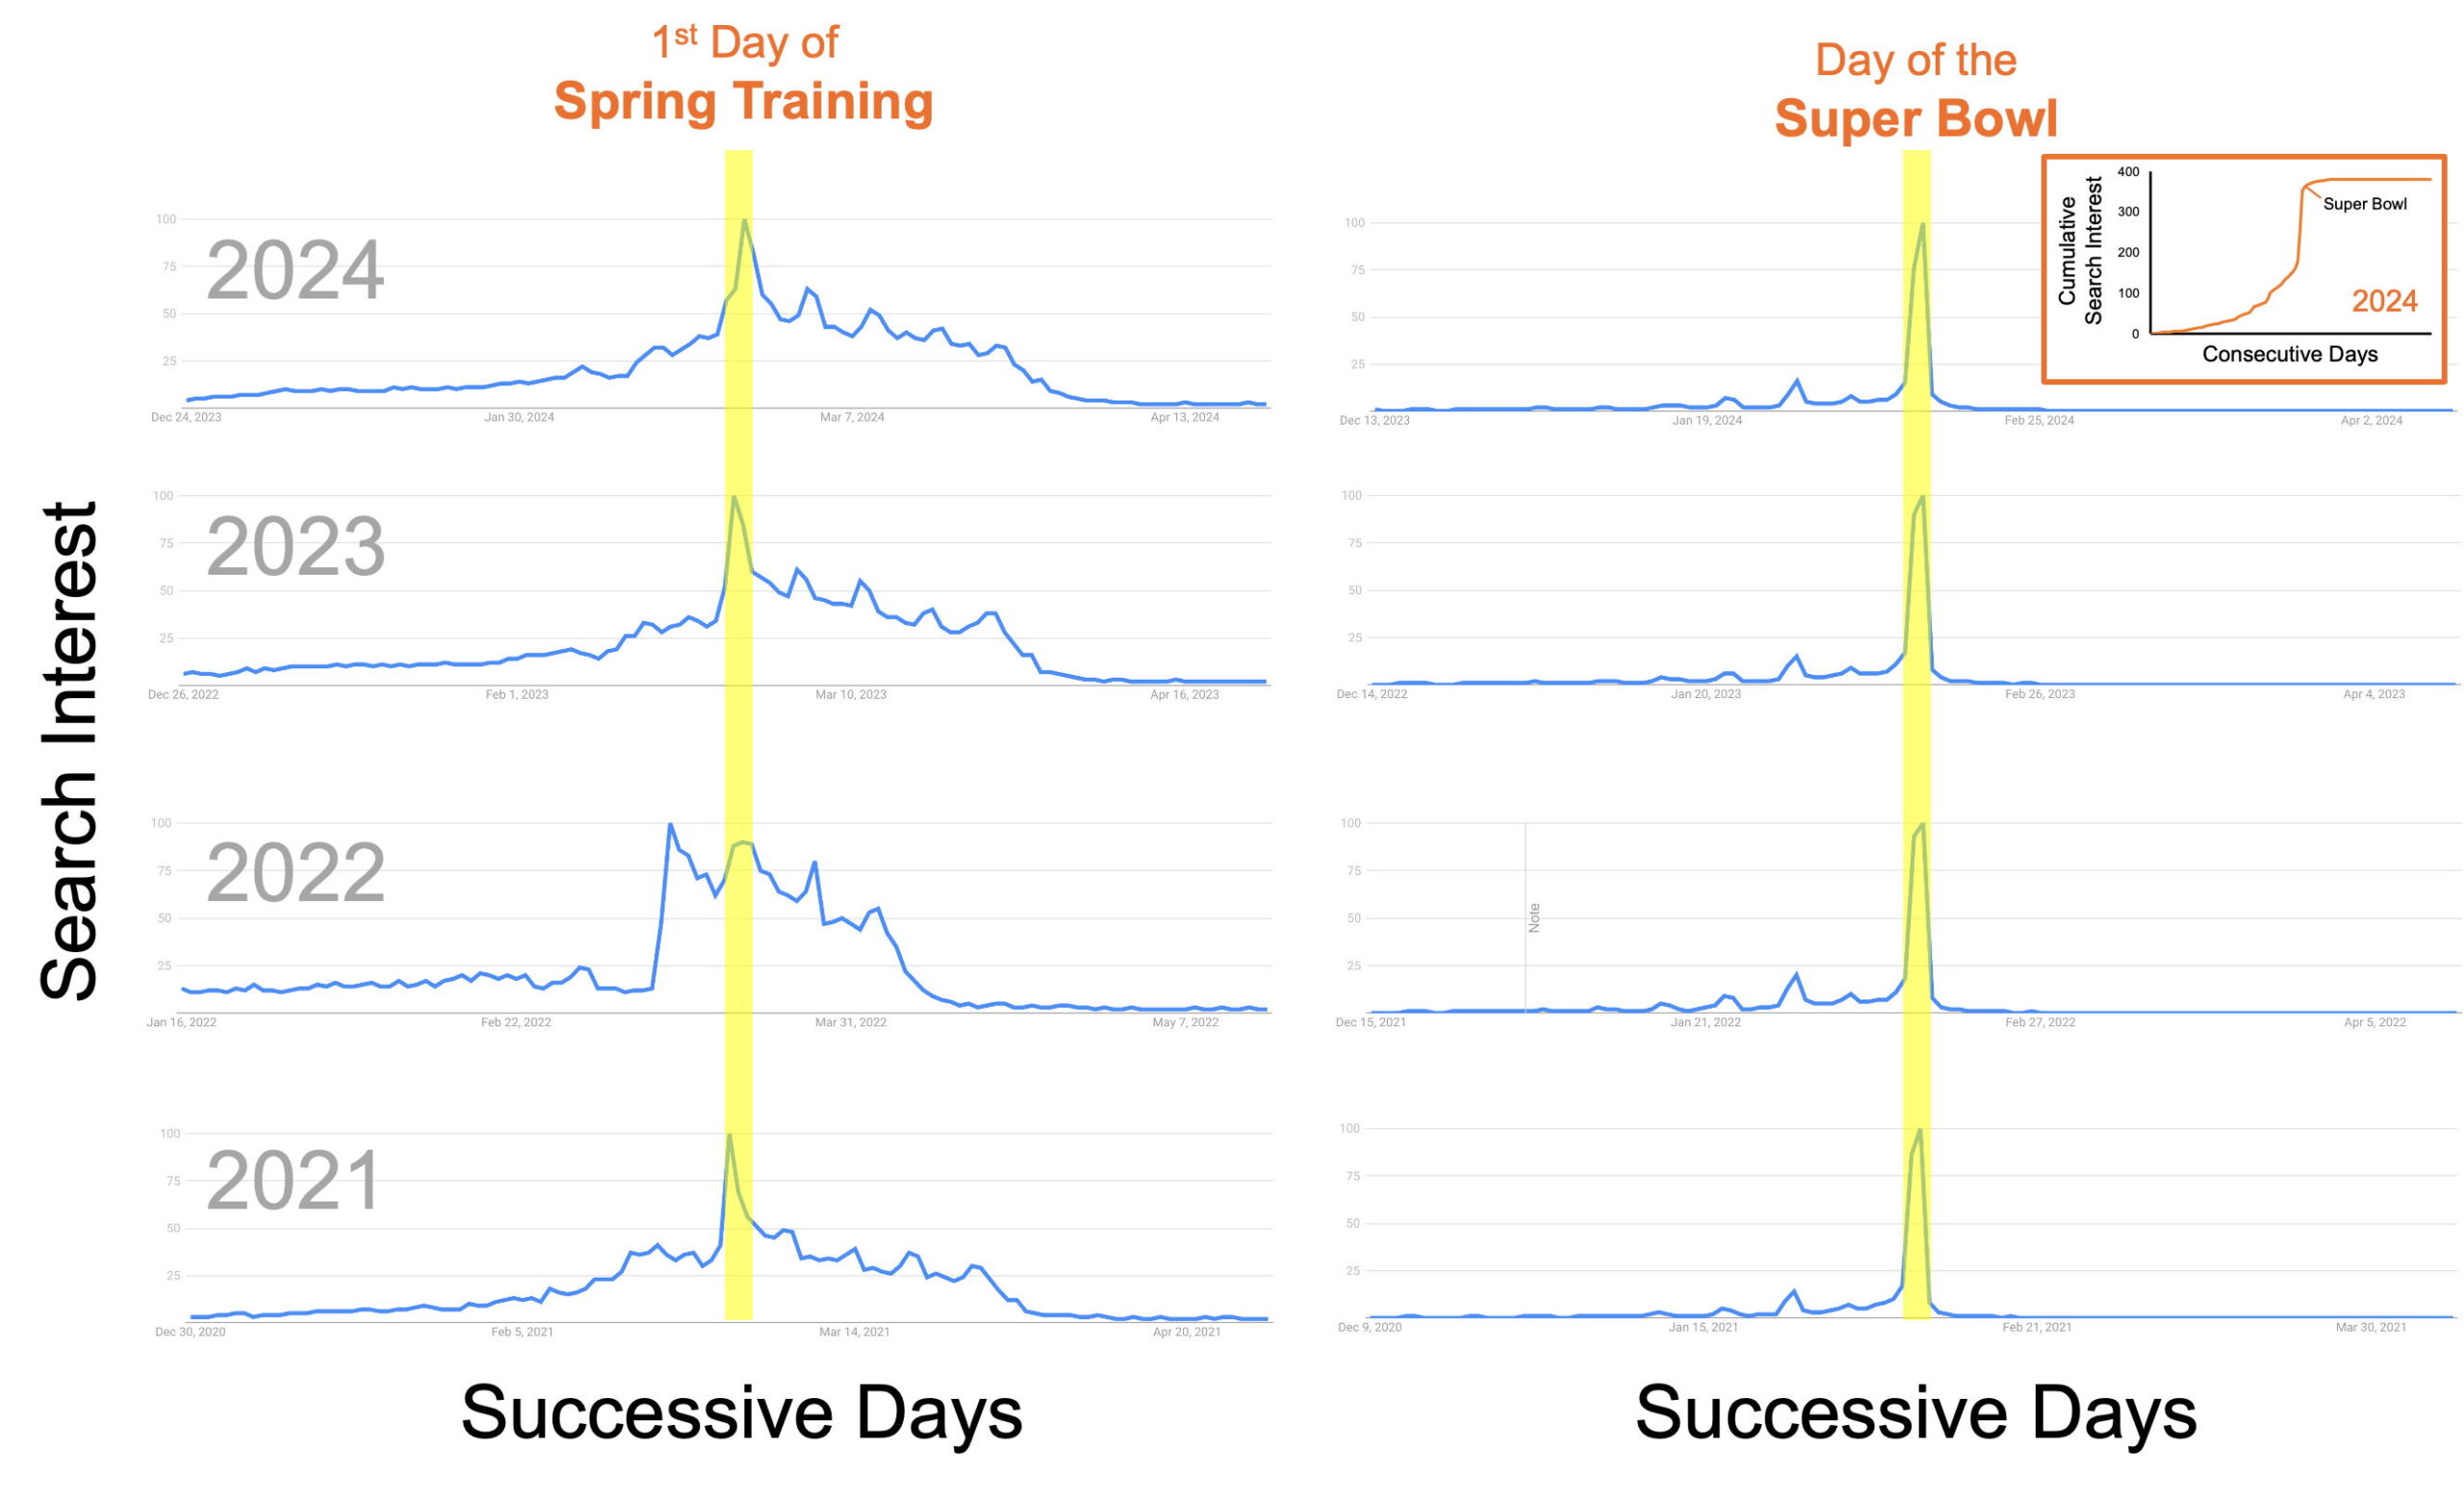
That’s not exactly the case for spring training searches. For each of the years 2021-2024, I obtained relative search frequencies for the 45 days before and after the start of Spring Training (see Postscript 4 for a note about these data). Below (left side; not cumulative plots) you can see that for all four years there’s some approximation of the expected gradual uptick in spring training search interest as the start of Spring Training approaches. But once Spring Training begins, that interest falls off more gradually than I predicted.
Here we confront some of the challenges in using data to make sense of everyday phenomena: The data are descriptive (not experimental), and phenomena of interest probably don’t map identically onto the relatively straightforward contingencies that lab research examines (see Postscript 5). In this case one relevant issue is that the putative reinforcer, news related to Spring Training, is available across about a month rather than a punctate event. In the lab, a FI reinforcer is over in seconds, and there’s one per customer per interval. So in this sense we have an imperfect analogue of fixed-interval contingencies.
However, there are some events of great interest to sports fans that are closer to punctate. The Super Bowl, the championship game of the U.S. National Football League, is played on one day every February (and after that, football season ends). The right side of the graph above shows that Google search interest in super bowl picks up sharply just before game day, and then drops to almost nothing immediately afterward. The little inset is a cumulative graph for 2024 (extended an extra 30 days prior to Super Bowl Sunday), verifying that this translates to the familiar scalloping pattern.
In this context, the slow decline of spring training search interest may be simply the result of an additional reinforcement schedule. For as long as Spring Training lasts, most new Google searches are likely to yield interesting (to a diehard fan) information. So, think of that period following the start of Spring Training as part of the (extended) reinforcer in a compound reinforcement schedule (first FI-like, then ratio-like, approximating continuous reinforcement).
I said may. Even if you’re inclined to buy my explanations, this is all descriptive and inherently somewhat ambiguous. But it may prove challenging to experimentally analyze behaviors related to competitive sport, and where data on everyday behavior are available — even descriptive data — it makes sense to see what can be seen in them. And, geez, having imperfect data is better than having no data. And there are many, many things people do every day for which our science has no data at all.
In conclusion, by no means am I trying to persuade you to like baseball. My point is that a lot of humans out there do a lot of searching for information on topics that interest them, and a science worth its salt should be able to make sense of this behavior (say how it relates to general principles of behavior). The kind of exercise in which I indulged here is an interesting (and necessary) test for our science and, who knows? If we do this sort of thing often enough, with enough phenomena, we might just make progress toward becoming the kind of science that everyday people turn to for insights about their everyday lives.
Postscript 1: Countries Outside of the U.S. with Professional Baseball
At least these countries have men’s professional leagues: Dominican Republic, Cuba, Mexico, Panama, Nicaragua, Venezuela, Columbia, Japan, South Korea, Taiwan, Italy, The Netherlands, Sweden, Germany, and Australia. There have been several professional baseball leagues for women, with a new one set to launch in the U.S. in 2026.
Puerto Rico, which is technically owned by the U.S., but not much supported by it or allowed a meaningful say in its political machinery, and therefore functions quasi-separately, also has a professional league. Puerto Rico, thank you for Roberto Clemente, Carlos Beltrán, John Candelaria, Orlando Cepeda, Carlos Correa, Edgar Martinez, Yadier Molina, José Pagàn, Iván Rodriguez, and Benito Santiago, among others. But not so much Jàvy Baez.
Postscript 2: Satiation
Satiation is a special case of the more general phenomenon of habituation, in which repeated exposure to a stimulus weakens the response to it. Satiation to reinforcing stimuli means that repeated exposure to a reinforcer makes it temporarily less effective in maintaining behavior, which is one reason why reinforcer variation is often recommended in ABA practice. Satiation can be employed strategically as an intervention for unwanted high-probability behaviors, as in Ayllon’s (1964) famous case of using it to eliminate a patient’s towel hoarding. The restricted interests of persons with autism may represent, in part, a selective failure of satiation mechanisms. It will come as no surprise to anyone who’s ever been stuck at a dinner table with a baseball fan that resistance to satiation also can be associated with certain kinds of psychopathology,
Postscript 3: About Google Trends Data
The available data have all kinds of shortcomings, but are better than no data at all. Some issues to note:
- Google Trends will tell you about relative search interest in some term across time, but in most cases not about the raw number of searches. Relative search interest is presented on a scale of 0 to 100, in which 100 represents peak interest during whatever time interval is being evaluated. Thus, for any given time point, what you know is how interest compared to peak interest during the interval of interest. That works okay for present purposes, because you could describe the scallop in operant research as (among other things) showing how relative behavior frequency changes over time. The graphs presented here capture how relative search interest changed over time.
- Trends shows rounds interest into whole integers, and when interest is less than 1% of peak for the evaluation period, it indicated “< 1.” I treated those instances as zeroes.
- Unlike the fixed-interval scallop of laboratory research, which summarizes the behavior of one individual, Trends data are by definition crowdsourced — they’re the aggregate behavior of many Google users. Trends doesn’t say how many individuals contributed to the unspecified raw totals of searches mentioned above, much less how much searching each individual did. There is, however, some reason to think that multiple individuals working collectively on a schedule of reinforcement can produce scalloping.
- Trends has been shown to be subject to Inconsistencies and errors. some systematic, though the relevance of this problem to data on spring training searches is unknown.
Postscript 4: About the Data in Those Graphs
- To create the plot for 2004-2025, and the inset showing the past three baseball seasons (2022-2024), I treated relative search interest values, on the 0-100 scale, as if they were raw search frequencies. For example, for the first two months of the graph relative interest was 28% and 38% of the peak interest during the 20-year period. In my data set, then, for Month 1 the cumulative interest was 28, and for Month 2 is was 66 (28 + 38). And so forth. This isn’t ideal, but the approach doesn’t distort what raw search data would show, since the values for each time point all are presented as a proportion of the same target value. In complex mathematical terms, Trends divides each raw interest total by a common denominator.
- In the plot of daily search interest, for each year the denominator is defined by the peak interest day of the 90-day period examined for each year.
Postscript 5: Regarding the Uncertain Match Between Laboratory Contingencies and Everyday Events

In a 1958 speech, Joseph V. Brady suggested that the reinforcement contingencies governing the bill-passing behavior of the United State Congress were much like those embedded in a fixed-interval schedule. Weisberg and Waldrop (1972) confidently did the same when publishing these data showing the predicted scalloping.
This prompted objections. For example, Dick Malott published a dismissive blog post saying that Congressional contingencies were much too different from those of fixed-interval schedules for scalloping, as shown here, to represent the same behavior dynamics as seen in the lab (the original post seems to no longer exist, but you can find vestiges of Malott’s argument here). Roger Poppen (1982) raised similar questions, and more, in a detailed Behavior Analyst article.
I won’t address these objections except as follows. First, how well a behavioral analysis of descriptive data depends on how firmly it’s grounded in behavior theory and the behavior analysis experimental literature to illuminate both the possible function of everyday behavior and possible pitfalls of extrapolating from general principle to any specific instance. Second, as my co-authors and I pointed out a while back, it’s absolutely true that a lot of real-world contingency systems are messy compared to what’s been investigated in the lab. But contrary to the stances of Malott and Poppen, the available laboratory data do in fact provide encouragement that “FI like” behavior can emerge from the impure contingencies governing lawmakers’ behavior. See our paper for specifics.
