The newest issue of Perspectives on Behavior Science (PoBS), just out, includes a collection of articles based on the annual meeting of the Society for Quantitative Analyses of Behavior (for a preview, see Editor Tim Hackenberg’s lovely introductory essay).
 I know that many of you began to zone out the instant you saw the word “quantitative,” but the title of Tim’s essay, “Adding tools to the behavioral toolkit,” conveys precisely why you shouldn’t. Long ago, Francis Bacon wrote that, “Nature, to be commanded, must be obeyed.” This includes employing the investigatory tools that fit your subject matter (having a hammer doesn’t make everything a nail). And guess what? The world of behavior is so big and dynamic and complex that we need all kinds of tools to reveal its secrets.
Quantitative analyses can tell us things that 1960s-style work (which continues to dominate our science and practice) cannot. And since these tools are out there waiting to be harnessed, I don’t think you can call yourself a responsible behavior analyst without knowing at least a little about quantitative methods. Fortunately, that isn’t as scary as you might think. See my thoughts on this below — just maybe I can weaken your resistance to checking out those quantitative papers in the new issue of PoBS.
Preface: Mathematical Magic on TV
In January of 2005, CBS TV debuted a ridiculous series called Numb3rs, about an FBI agent who collaborates with a mathematical genius to identify unrecognized patterns in criminal behavior. What was ridiculous in Numb3rs was not the notion that math can reveal patterns in behavior — far from it, as I’ll discuss shortly — but rather the assumption that mathematical reasoning could be made engaging to a non-mathematical audience.
We know that the CBS audience was largely “non-mathematical” because around the time Numb3rs premiered a report from the Organisation for Economic Cooperation and Development ranked US students 24th out of 29 industrialized nations in mathematical proficiency.
Side note: Things are no better today: The United States ranks only 26th among 81 nations that were evaluated on math achievement scores. Only 7% of U.S. high school students score in the top tier of math scores, and ,in the most recent round of testing, scores plummeted compared to pre-COVID levels. And don’t forget the destructive influence of constructivist approaches to mathematics education, which triggered and are ongoing combatants in the “Math Wars” that have raged in teacher education since the 1990s.
Of course, nobody who teaches undergraduates in disciplines like Psychology needs to see achievement test scores to note the woeful state of numeracy in the U.S. At my university, Psychology majors delay taking required research and statistics courses absolutely as long as possible, mainly because these courses might force them to encounter numbers (numb3rs?). And I regularly see students who do not understand averages, percentages, and fractions — this at what is regarded as Illinois’ second university in academic quality (after the AAU/Big Ten University of Illinois at Urbana-Champaign).
But back to Numb3rs. Early episodes seeded the dialogue with quantitative-sounding, but mostly unexplained, pronouncements (Heisenberg uncertainty principle! The Reimann Hypothesis!). The cinematography featured many close-ups of the mathematician, furrowing his brow and frantically scribbling equations on a blackboard while dramatic music swelled. If you’re not familiar with the series, this trailer will give you an idea of what I’m talking about:
Numb3rs was popular enough to last for six seasons, but I’ll bet you several beers that most viewers had no clue what was happening in the mathematical plot machinations. Indeed, early on in the show’s run producers grasped that the magical-mystical-mathematical blackboard scenes weren’t going to sustain a lot of interest, and resolved to inject the series with “more heart.” Blackboard scenes and mathematical mumbo-jumbo became less common after that.
 So clearly the show didn’t attract viewers because they adored math. Or were curious to find out more about it. And good thing, because the show never presented math coherently enough to teach viewers anything meaningful (although the series’ “Principal Math Advisor” gave this a go in a book called, “The Numbers Behind Numb3rs: Solving Crime with Mathematics).
No, given the marginal numeracy of many Americans, my guess is that most viewers regarded the mathematical legerdemain of Numb3rs much as they would feats of fictional wizardry: They were happy to see this force marshaled for good but — just as Lord of the Rings fans don’t ask a lot of questions about how Gandalf’s powers work — they simply took it on faith that such magical outcomes were possible.
Mathematical Magic in Behavior Science
It goes without saying that such willing suspension of disbelief is antithetical to the way a science-driven discipline is supposed to operate. Which is why I found it unsettling that rewatching Numb3rs episodes on my streaming service set me to musing about the contemporary fate of the Quantitative Analysis of Behavior (QAB).
QAB arose in the experimental analysis of behavior nearly 60 years ago and in many ways has revolutionized behavior theory, adding significantly to what we know about competing responses, extinction, persistence, “impulsivity,” and much more. There’s an entire organization, the Society for the Quantitative Analysis of Behavior, devoted to this kind of work, and each year they hold a lively convention-within-a-convention in conjunction with the ABAI annual meeting (here’s the 2024 program).

QAB is concerned with fitting mathematical functions (equations) to behavioral data, but it’s not just a numerical nerd exercise. Nor is it a vacuous display of fantasy magic as per Numb3rs. Equations have the capacity to describe and reveal complex functional relations in ways that mere words cannot. They capture ideas about behavior that may be too big for words to convey simply or accurately. And they can lead to counterintuitive predictions (such as circumstances under which punishment should strengthen, rather than suppress, behavior, to mention just one) and to better understanding of everyday problems.
In the latter case, in applied behavior analysis, over the years we’ve seen several waves of QAB influence involving delay discounting, then the matching law, then behavioral momentum. Recently there’s been a ton of quantitatively-informed attention to resurgence following extinction, about which I’ll say more momentarily. Despite all of this, we still have relatively few practitioners of the mysterious QAB arts, and more to the point relatively few behavior analysts who are capable of even reading about QAB research.
This is a real blind spot for our discipline. Quantitative methods get limited attention in most behavior analysis graduate programs and aren’t even mentioned in the most recent Task List defining knowledge competencies for Board Certified Behavior Analysts. The result may be like one of those blackboard scenes in Numb3rs. Picture an applied behavior analyst flipping through a journal to an article on quantitative insights about behavior (like this one). Hear the music swell as the camera pans to various equations, while our protagonist utters phrases that sound super science-y (but, to the uninitiated, communicate nothing): The matching law! Inelastic demand! Behavioral momentum theory!
Give me a minute while I wipe this tear from my eye.

So, what’s lost when the majority of a discipline can’t understand its own innovations? To give you a sense of the magnitude of the oversight, I searched Web of Science for articles with delay discounting or temporal discounting in the title. My search returned 6,621 articles (and this is just one of many domains of QAB). I hope it’s obvious that if you can’t critically read stuff like this, a ton of valuable information about the functions of behavior is beyond your reach. Sure, maybe you can find someone to summarize selected insights in words, but you’ll be missing a lot.
Want a partially illustrative example of the limitations of words? Check out an article (“How America’s fastest swimmers use math to win gold“) on the use of complex measurement and quantitative modeling to improve the performance of elite competitive swimmers. This article gives you the gist of certain innovations but, based on the article alone, I challenge you to to develop your own studies in this area or to apply relevant findings to help other swimmers. For that, you need technical details that a purely narrative account, like this article, does not and cannot provide.
Look, I completely get it: If you don’t have the proper background in math, absorbing equation-based behavior theory is really hard. I know from personal experience: My B.A. in English Literature did little to prepare me for QAB. For a lot of behavior analysts who come out of relatively non-quantitative fields like Psychology and Special Education, it’ll be a challenge to absorb and appreciate what QAB has to offer. But that doesn’t make it okay to be — apologies for my aggressive word choice here — ignorant. If you can’t follow advances in your field, you get left behind, and you’re guilty of promoting archaic science and practice.
I say that in part because pretty much all current ABA interventions are imperfect, meaning that they produce different levels of benefit for different individuals (e.g., consider the range of outcomes with Lovaas-style early intervention for autism). Plainly put, this means that even with our “best practices” some people get less help than they deserve, which is ethically sketchy within the concept of a client’s right to effective treatment. Therefore, as my colleagues and I wrote a few years back:
Interventions should be held accountable not simply for being the best available but rather for being the best possible. Given the costs associated with suboptimal services, and the near certainty that better interventions are possible, every … service provider should be deeply dissatisfied with the current state of ABA services and hungry for the rapid development of better alternatives. It is of paramount importance, therefore, to determine where better interventions come from so that they may be identified and embraced as quickly as they become available.
One place better interventions come from: quantitative analyses of behavior. See the next section for an example.
Quantitative Progress on Resurgence
Resurgence, the re-emergence or return of formerly extinguished behavior, has gotten a lot of attention in applied behavior analysis lately, and justifiably so. Many ABA interventions incorporate extinction, and thus in terms of intervention effectiveness resurgence marks a job incompletely done. You can’t be really good at ABA unless you can anticipate and mitigate resurgence.
And that can be hard, because resurgence is a complex phenomenon. For instance, check out a fine narrative-style review by Lattal and Miles (2024) that identifies many of the variables responsible for resurgence and explains how resurgence is similar to and different from behavioral contrast. This is an erudite and informative paper, but holy crap, it’s a lot to absorb, a real forest-and-trees challenge borne of resurgence being a function of many variables. That’s no criticism of the authors, only an acknowledgement that as a topic becomes more complex it becomes harder to summarize succinctly with only words.
To state the problem another way, complex behavioral phenomena reflect the interaction of many influences (see Postscript 2). Now, it takes special learning experiences to accurately put two-way interaction effects into words, and without statistical tools most people can’t talk coherently about three-way interactions. Beyond that, well, words fail completely.
Now, as a point of comparison to the Lattal and Miles paper, check out an equally fine paper by Greer and Shahan (2019), which identifies some limitations of word-based accounts of resurgence and introduces a quantitative perspective based on behavioral momentum and operant choice theories. Greer and Shahan do a great job of explaining where the equations that speak to resurgence come from and how they are useful in fueling predictions of potential therapeutic value. I won’t repeat their arguments except to summarize a key tension that exists when quantitative approaches are introduced to a narrative discipline.

Let’s start with the shock that word-oriented folks experience when encountering scary equations. Above is one of the equations discussed by Greer and Shahan, and about it two things are certain. First, given the sad state of mathematics instruction, many of us have had really bad experiences with math, so seeing equations like this may elicit unpleasant conditioned emotional responses that interfere with learning. Second, any equation is meaningless without some explanation and unpacking. For the uninitiated, that means work, and work is only worth it if it yields sufficient reward. Here’s Greer and Shahan’s take on why the required exertion is worth it:
Equations… describe how exposure to abroad range of environmental conditions impacts behavior. In addition to summarizing, the equations can convey relations that are difficult to describe in words. Once the insights provided by an equation are understood, it can open up new and more fertile ways of thinking about a phenomenon. It is here that spending some time to understand a quantitative model can pay dividends for an applied behavior analyst. An understanding of the theory can lead you to see the situation in a different light, and thus, the actions you take or the interventions you consider might be entirely different…. The insights provided by a quantitative theory hold the promise of inspiring innovative and durable behavioral interventions.
What QAB gives us are convenient snapshots of complex interactions. The input consists of data from multiple independent variables, and the output is one or more “fitted parameters” — each a single, empirically-derived value that describes a complex behavioral function. For instance, as Postscript 2 describes, the equations of delay discounting return a value, called k, which summarizes how the probability of “impulsive” choices varies across a range of circumstances. Fitted parameters are a sort of higher-order dependent variables that succinctly communicate more than your typical direct measure of behavior.
Seriously, if your work bumps into extinction and resurgence, make sure you’ve read the Greer and Shahan (2019) article! But am I saying that this paper is easier to digest than Lattal and Miles (2024)? Absolutely not — it represents a different kind of work, with a different kind of benefit.
Conclusion: Time to Catch Up
Quantitative models are tools. Not all tools are quantitative, but all tools require effort and practice to master. Consider a not-very-scary example. Let’s say you’re a smart undergraduate who’s just begun learning about behavior science, and you’re introduced to the tool called functional behavioral assessment. This is no quantitative model, but you are not going to get all of the nuances at at a quick glance, because a vast amount is known about the functions of behavior, about various ways of assessing them, and about various ways that functional assessment data can inform interventions. The expertise required to use functional assessments comes only with time, effort, and practice.
And so it is with quantitative models of behavior. It’s important to stress here that a special level of mathematical skill is required to create and test quantitative models — but fortunately much less is required to benefit from the insights these models provide. I can’t teach you advanced math, but Postscript 1 suggests some places to dive in on QAB and, as Postscript 2 hopefully illustrates, the underlying math becomes considerably less mysterious and foreboding when you understand the goals to which it’s being applied. Indeed, if you understand independent and dependent variables, and understand their role in equations, you can grasp a lot about what quantitative models are telling you about behavior, even if the underlying calculations are a reach for your mathematical skill set.
Postscript 1: Some Introductory Resources on Quantitative Analysis
SQAB archives a variety of tutorials and other QAB presentations on its YouTube channel. This is a wonderful resource, although a lot of the content may not be he right place to leap in for newbies who are quant-curious. For a slightly more gentle introduction, consider the following papers, which take various approaches to explaining what QAB is for and how it works (without getting too bogged down in the mathematical magic). Once you get started, there are lots of rabbit holes to go down, and in the end you can’t do this without freshening up your math. But the alternative to making this start is to remain half a century behind cutting edge behavior theory and its implications for practice.
FOR CONTEXT
If you’re completely new at this, to set the mood consider beginning with Jack Marr’s description of complex systems, below, the criteria for which, when you think about it, are met by pretty much all behavior:
(1) a number of interacting components or subsystems, that is, the states of these systems are correlated in some way
(2) nonlinearity, that is combinations of states or inputs are not additive (or subtractive)
(3) the behavior of the system is not predictable from separate consideration of its components, but only from understanding the relations among them. This is what is typically meant by emergence.
(4) There are spatial and temporal scale-invariant properties such that no characteristic event size or time controlling the evolution of the system. This means their stochastic properties will follow power laws
(5) Self-organization in which patterns emerge from within the system through mutual interaction of the system’s elements. This occurs under certain critical states or conditions, sometimes called self-organized criticality.
(6) The complex global behavior of the system can sometimes be described by relatively simple, deterministic rules. [Editorial comment: But the devil is in the details, which is where quantitative analyses come in.]
The key point is #2. Words, and our relatively simple single-case designs (like reversal and multiple baseline), are pretty linear, placing a lot of emphasis on “A causes B” explanations. But behavior is nonlinear (multiply determined), so a thorough understanding of it is going to require something more, something capable of depicting nonlinear effects.
You might also consider skimming Marr’s paper, “Some remarks on the quantitative analysis of behavior,” which establishes a context for QAB in the long history of scientific advances (trigger warning: if you’re equation-phobic, a mid-article digression is going to lose you).
FOR A non-mathematical PREVIEW OF WHAT QAB IS FOR
- Crichfield & Reed (2009). What are we doing when we translate from quantitative models? The Behavior Analyst. Attempts to de-mystify equations by explaining how they are cobbled together from rather common-sense ideas.
- Jarmolowicz ett al. (2021). Applied quantitative analysis of behavior: What is it and why we care. Perspectives on Behavior Science. A quick review of some of practical insights that have come out of QAB (without wading into the equations themselves).
FOR AN INTRODUCTION TO SPECIFIC QUANTITATIVE MODELS
- Critchfield & Madden (2006). At the crossroads of time and action: A temporal discounting primer for prospective memory researchers. In Timing the future: The case for a time-based prospective memory.
- Greer et al. (2016). Behavioral momentum theory: A tutorial on response persistence. Journal of Applied Behavior Analysis.
- Killeen (2019). Timberlake’s theories dissolve anomalies. Behavioural Processes.
- Laureano & Falligant (2023). Modeling behavioral persistence with resurgence and choice in context: A tutorial. Behavior Analysis in Practice.
- Madden & Johnson (2010). A primer on delay discounting. In Impulsivity: The behavioral and neurological science of discounting.
- Reed & Kaplan (2010). The matching law: A tutorial for practitioners. Behavior Analysis in Practice.
- Reed et al. (2013). Behavioral economics: A tutorial for behavior analysts in practice. Behavior Analysis in Practice.
Postscript 2: Example — An Economical Quantitative Description of “Impulsivity”
I said above that the mathematics of quantitative analysis become more transparent when you understand their general purpose, which is to provide rigorous predictions about multiply-controlled behavioral phenomena. Here’s a partial example to whet your whistle.
Let’s do this in two steps.
step 1: what is delay discounting? what discounting effects must a quantitative model explain?
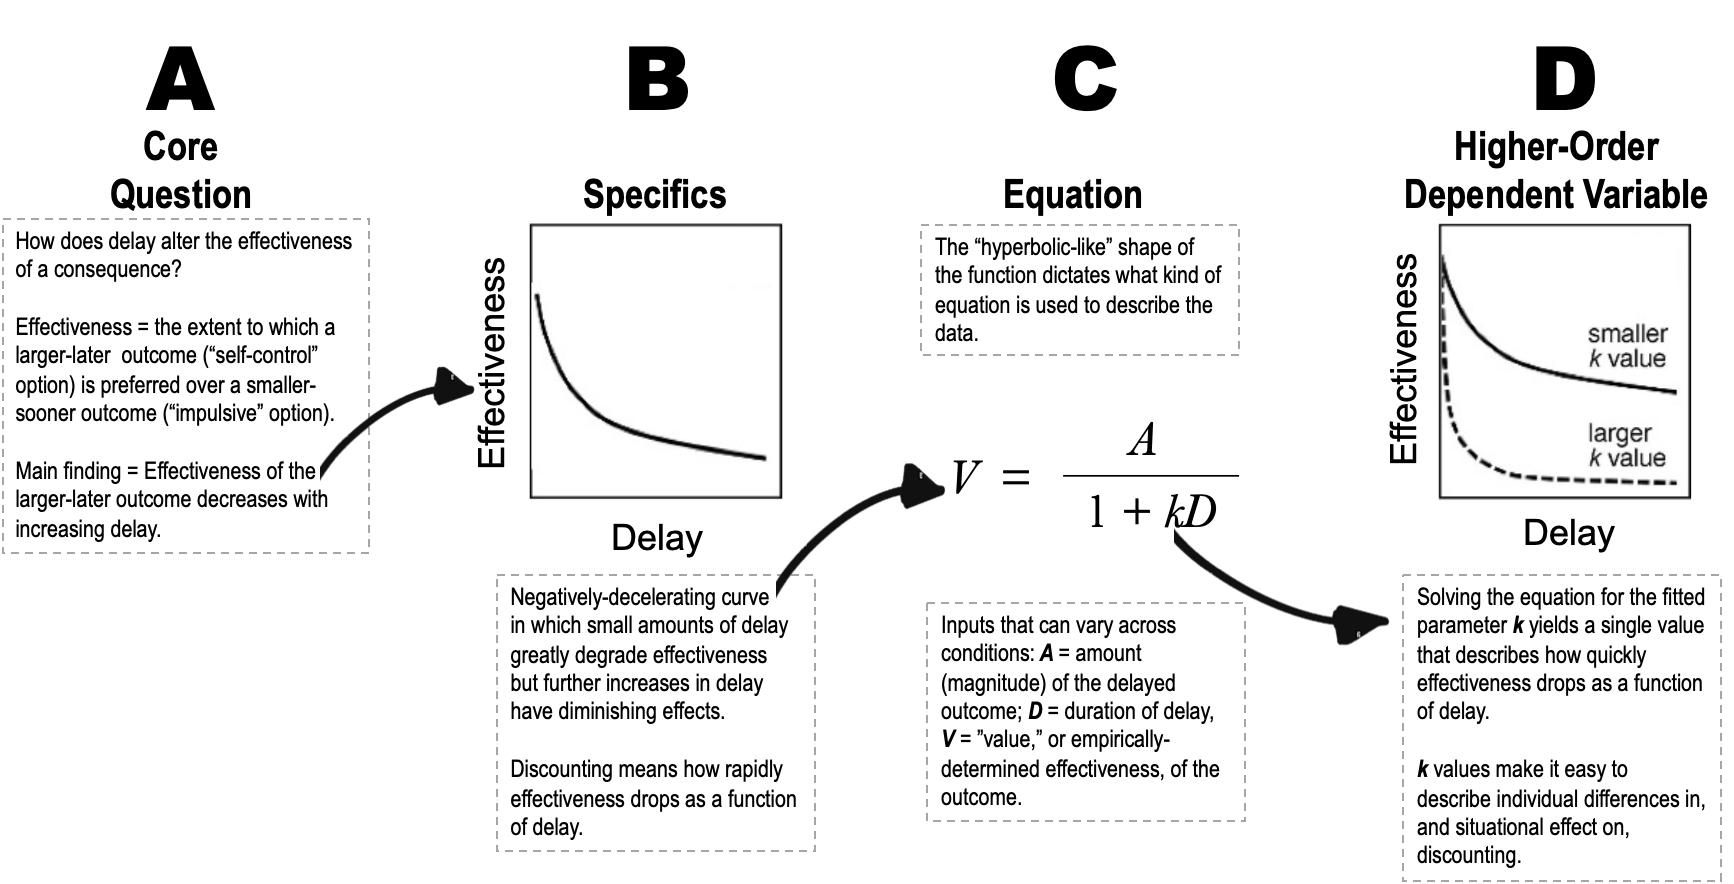
Panel A, below: What is casually referred to as “impulsivity” reflects a tendency to act in service of smaller-sooner consequences rather than larger-later ones. “Discounting” is this devaluing of delayed outcomes. To illustrate the effect, if I prioritize the small joys of Dairy Queen Blizzard desserts over the sizable health benefits of a long-term sensible diet, my behavior suggests — somewhat illogically, given what we know about the effects of reinforcer magnitude — that little Blizzards now are a more effective consequence (more valuable) than big doses of good health later. Research protocols examine this effect by setting up series of choices between smaller-sooner and various larger-later outcomes. The reliable finding: Preference for larger later outcomes decreases as their delay increases.
Panel B: Another standard finding is that the smallest bits of delay have disproportionate power to undermine effectiveness. Notice how the function linking effectiveness and delay, as it moves from left to right, drops rapidly at first and then flattens out somewhat.
Panel C: The mathematical details of the equation below (one of several proposed quantitative models of discounting) are dictated by the kind of function that must be described. All we need emphasize for present purposes is that certain kinds of data from a variety of test conditions are plugged in, and the equation is solved for a “fitted parameter” (k) that makes it easy to talk about complex discounting effects.
Panel D: k is a sort of higher-order dependent variable. It’s a single value that describes how quickly consequence effectiveness drops off as a function of delay, that is, a precise shorthand for the smaller-sooner versus larger-later choices that take place under a wide range of conditions and would require considerable wordage to describe (and imprecisely, at that).
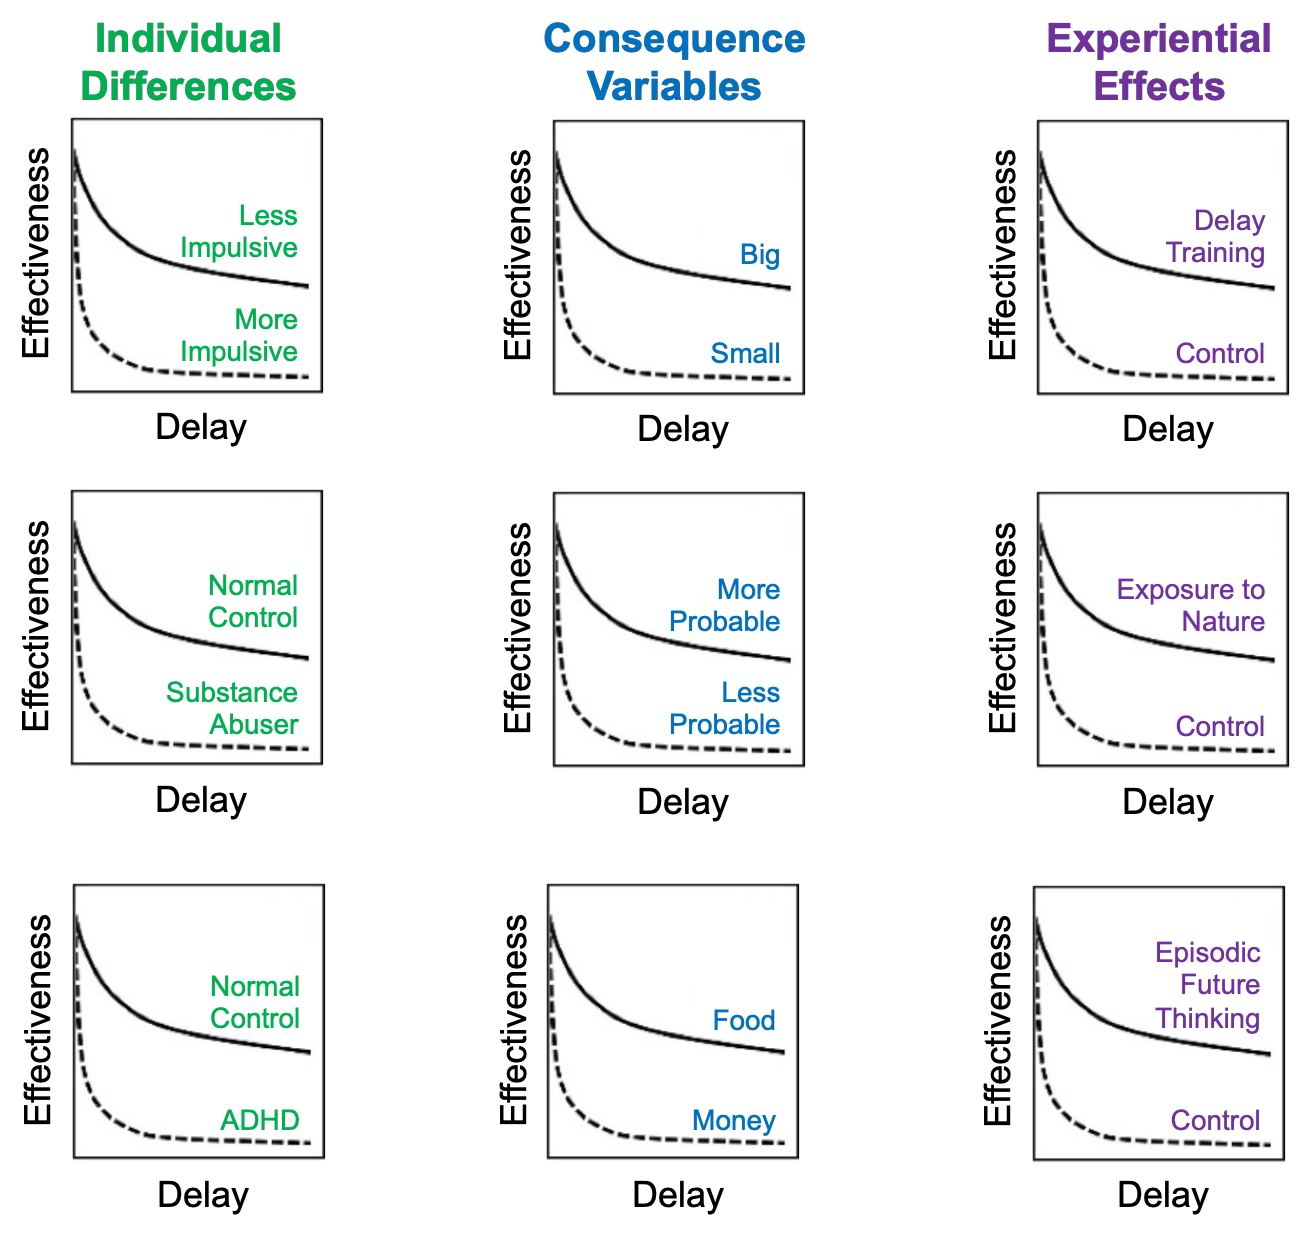
step 2: how the shorthand of k provides a common “language” for describing a variety of effects
Individual differences (left column). Some people are affected more by delay (bigger k value) than others, and this effect correlates with a number of pathologies like substance abuse and ADHD.
Details of the consequences themselves (middle). In general, discounting is especially pronounced (bigger k value) for consequences that are small in magnitude and occur with low probability. Different types of consequences are discounted to differing degrees, with generalized conditioned reinforcers like money apparently yielding less discounting.
Experiential context (right). Discounting can be lessened (reduced k value), at least temporarily, by special kinds of training, by spending time in nature, and by imagining specific kinds of events that will happen in the future, among other things.
final word: On the PLEASURES of parsimony
In extolling the virtues of quantitative theories over principles that are spelled out only in words, I’m not calling anyone who relies on narrative behavior theory mentally disturbed. But consider this observation from science fiction writer Philip K. Dick (in the novel VALIS):
The mentally disturbed do not employ the Principle of Scientific parsimony: the most simple theory to explain a given set of facts. They shoot for the baroque.
Once you consider all of the variables that contribute to discounting, and the baroquely dense wordage necessary to describe them in narrative form, it becomes easy to appreciate the joy that flows from an economical way of talking about behavior like k.

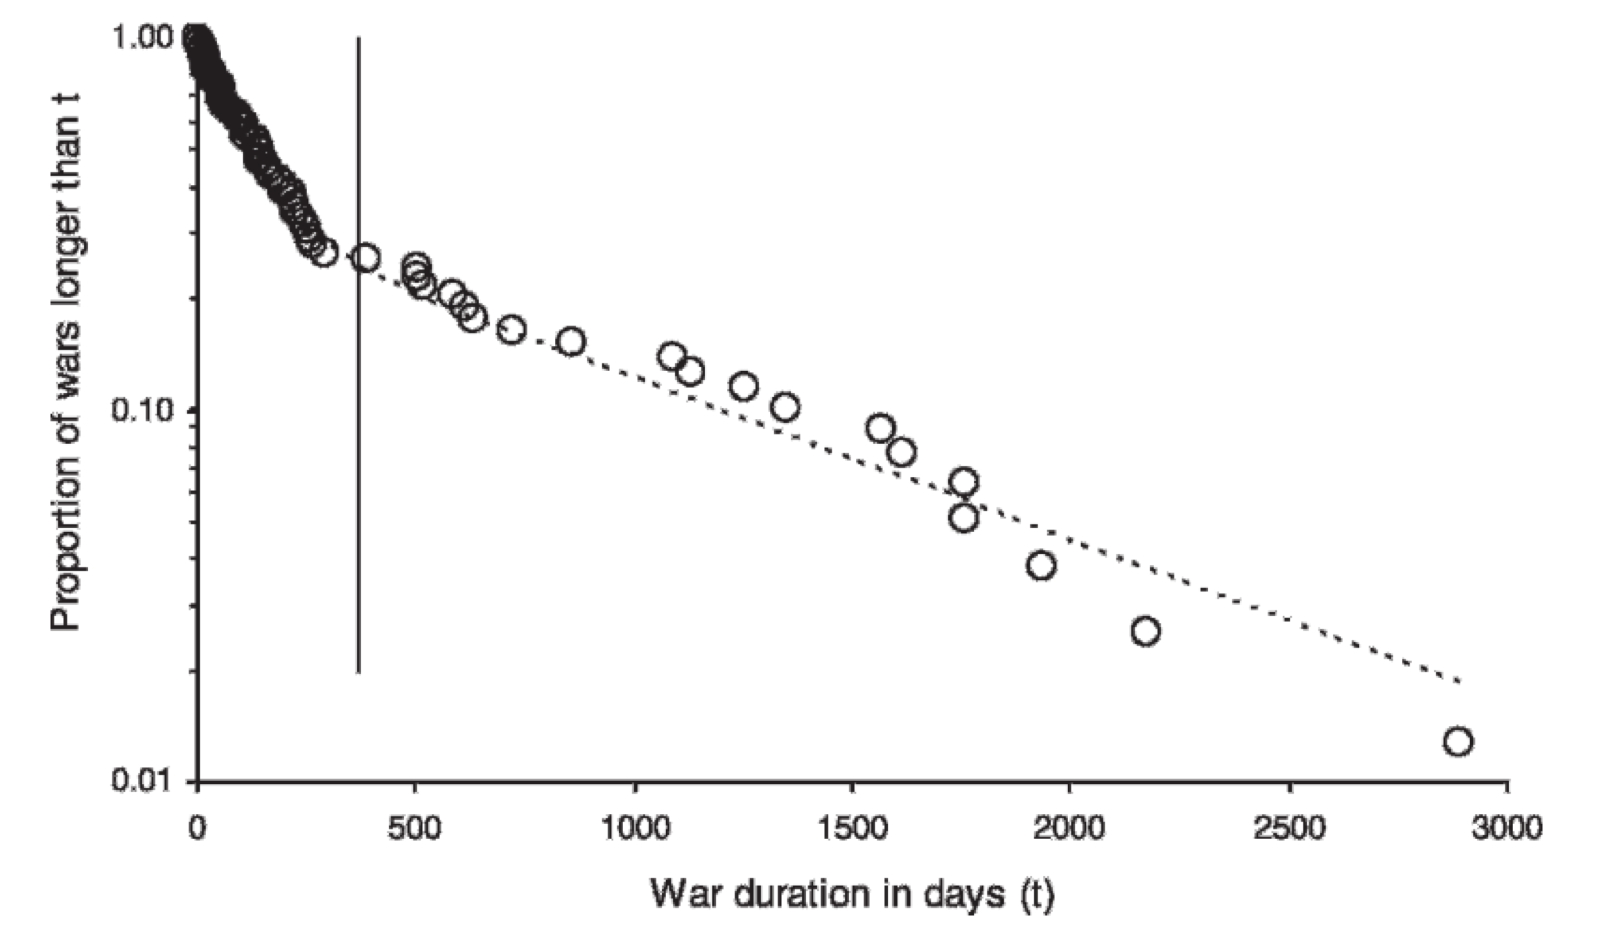
One of the founders of QAB, the late Tony Nevin, addressed that joy in a recommended article about how and why QAB became a mainstay of behavior science. At the end of the article, Nevin described combing through data bases about international armed conflicts (one of Tony’s passions was understanding war and means of preventing it; see here and here and here). He found a quantitative approach that made clear what the figure below displays: that different distributions apply to the durations of wars lasting more or less than about a year. We needn’t get into the practical implications of this pattern to appreciate Nevin’s reaction to finding order in chaos:
A combination of orderly data and a quantitative model permits at least probabilistic prediction, and I confess to feeling a genuine thrill when I entered the summed-exponential model into an Excel spreadsheet and saw the fitted line snap into place on top of the data points in Figure 1.
Indeed, the entire point of science is to unite a genuine passion for some topic with an understanding of its nuances. Quantitative analyses, once you become comfortable with them, do this especially well.