Heads I win. Tails you cheated.
Last year I posted on the fate of that one-time icon of operant data analysis, the cumulative graph. Most readers of this column know that cumulative recorders were once a staple of operant laboratory instrumentation (see here for a very detailed history), as illustrated most comprehensively in Ferster and Skinner’s (1957) Schedules of Reinforcement, which showed hundreds of examples of behavior dynamics depicted in real-time records produced by those venerable devices. Some early applied studies also employed cumulative graphs. But things change, and by 1976, in a piece titled, “Farewell my LOVELY!”, Skinner bemoaned the disappearance of cumulative records from behavioral journals (see the Postscript 1 for the full text of Skinner’s short eulogy).
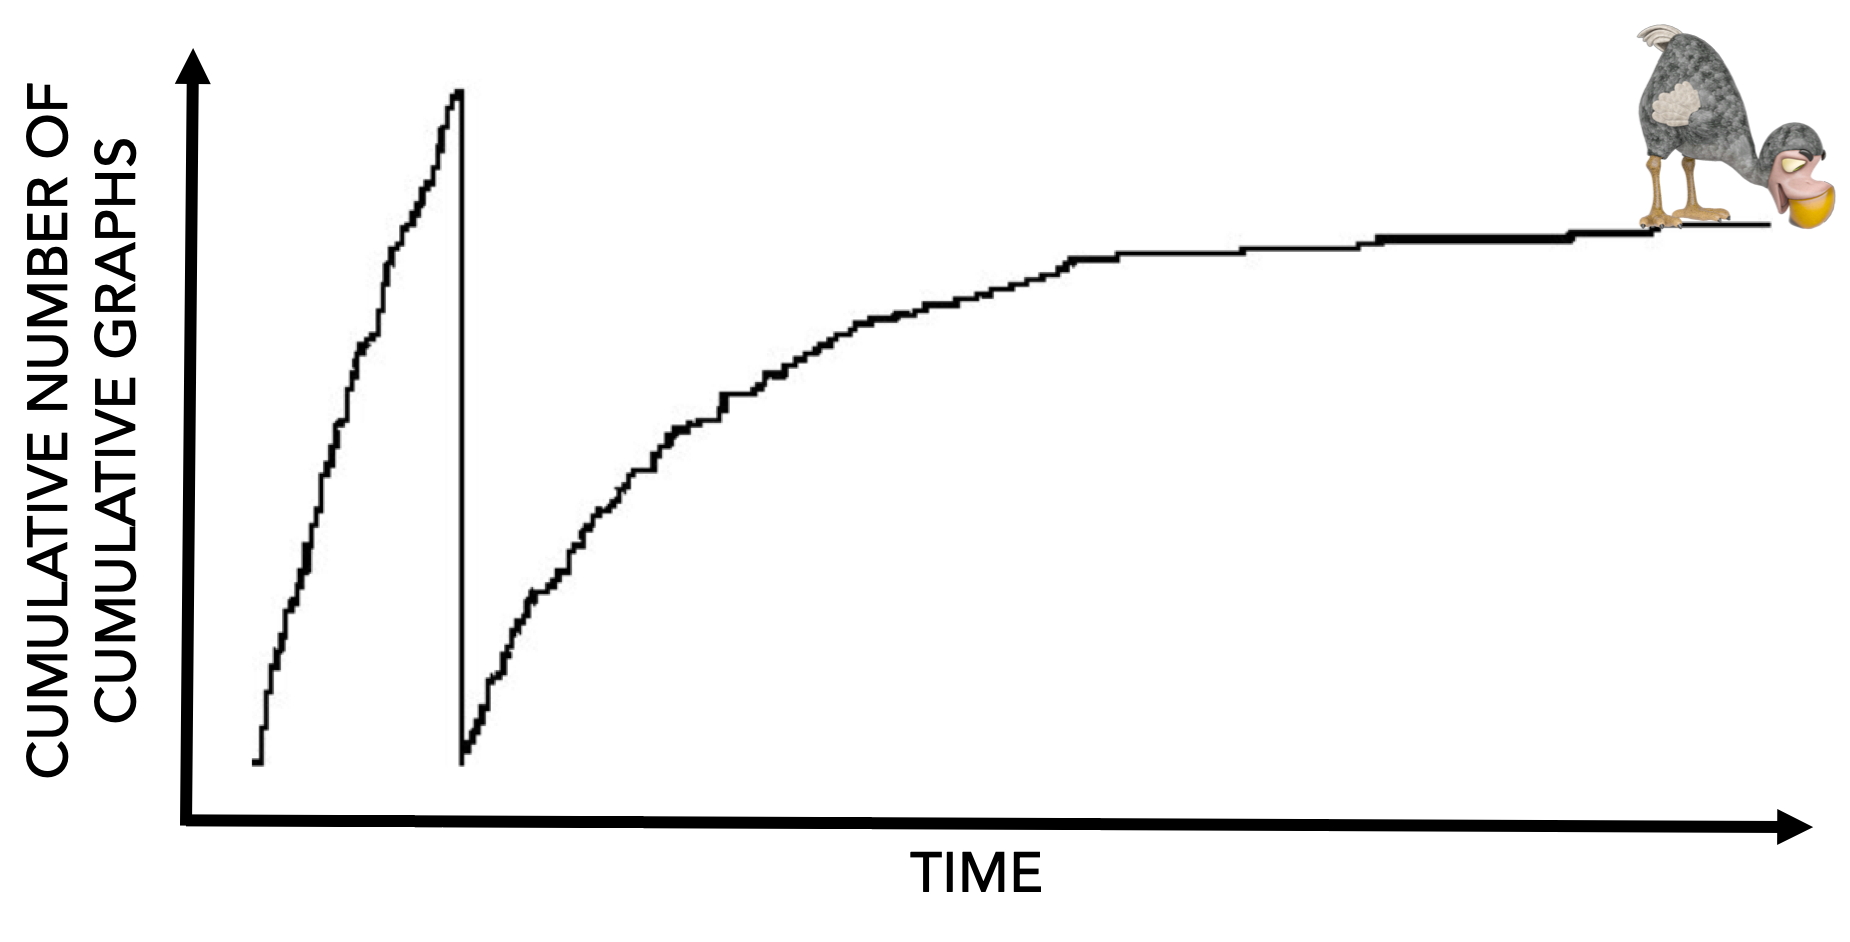
What happened? In part, the analog cumulative recorder fell out of favor as laboratories switched to digital technology (I’m old enough to remember how, during the transition period, people wrote custom code to convert digital data to cumulative records on a dot-matrix printer). Another contributing factor is that traditions of experimental design evolved: Formal reversal designs, as iconically described in Sidman’s (1960) Tactics of Scientific Research, replaced the less-structured exploratory approach that Skinner had preferred, and the questions asked by reversal designs are simply more molar than can be addressed by the “quick and comprehensive look at the fine grain of the behavior in the cumulative curve” that Skinner so cherished. In a sense, however, the reasons don’t matter because, in the end, in the world of behavior analysis the cumulative record went the way of the dodo.
A Swing and a Miss in Behavior Analysis, But a Home Run Elsewhere
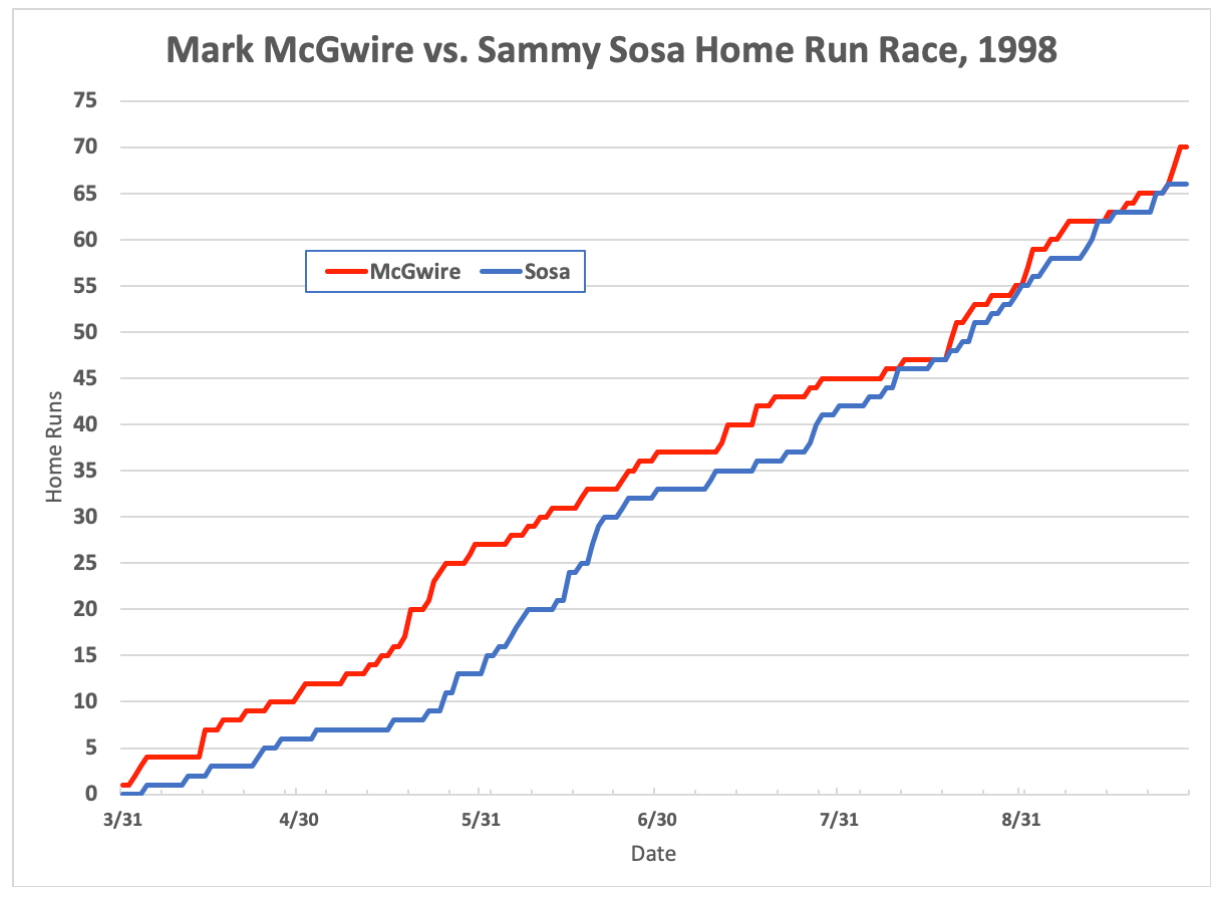
But as I wrote last year, cumulative graphs have had a healthy continuing existence elsewhere, particularly in the news media, where they are are a go-to tool for depicting changes in rate over time. Here’s one of my favorite examples, showing home runs hit by Mark McGwire and Sammy Sosa during their historic 1998 chase of Babe Ruth’s season record (see Postscript 2). You needn’t know a lot about baseball to understand “the fine grain of behavior” that excited baseball fans. Would Ruth’s “unbreakable” 71-year-old record (60 home runs) finally fall? If so, who would eclipse it first? And, who would ultimately win the suspenseful cat-and-mouse game played by Sosa and McGwire as hey battled through the final quarter of the season to determine who would own the new record?
In recent years the New York Times has been an especially prolific practitioner of the venerable craft of cumulative graphing. For instance, if you can get past the paywall, check out an extremely informative figure showing cumulative COVID-related deaths, 2020-2024, in U.S. counties with different degrees of support for Donald Trump as a presidential candidate (suffice it to say that, using the “red” versus “blue” metaphorical distinction of U.S. political positions, the Times refers to the key effect as “Red COVID”).
Speaking of Trump…
The Times has a new cumulative analysis, this time showing the frequency with which Mr. Trump has claimed that elections have been rigged against him. Here’s where the data come from:
The Times’s analysis counted specific references to “election interference,” “rigging,” “stealing,” “cheating” and related terms, as well as references to voter fraud, in posts on Twitter (now X) and Truth Social; at campaign events; and in interviews in the 2016, 2020 and 2024 election cycles. The analysis most likely represents an undercount of the number of times the former president has baselessly sown doubt about election fairness or integrity.
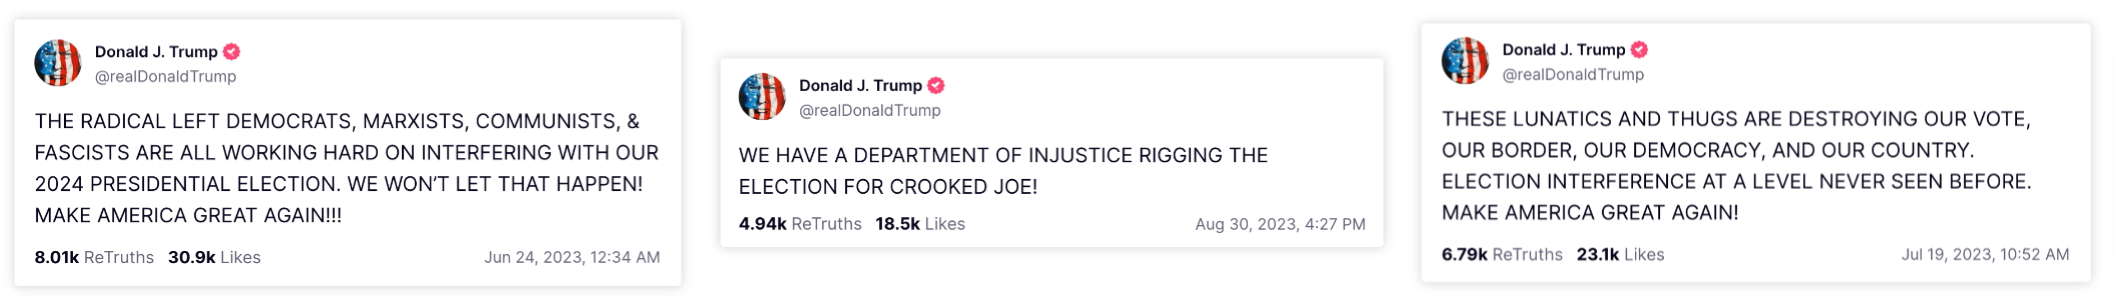
And here are a few examples of Trump’s claims from the Truth Social platform. For those not up on U.S. politics, the Times calls these claims baseless because numerous investigations and court cases have produced no systemic evidence of election malfeasance. For an example analysis, see here.
I can’t reproduce the Times’ cumulative graph because of copyright restrictions, but imagine three curves, one each for the 2016, 2020, and 2024 elections. The horizontal axis shows days leading up to an election, and the vertical axis counts cumulative claims of election funny business. Thus, in each curve you can see the total number of election fraud claims, as well as when these occurred. In each of the three cycles, claims were infrequent early on, but eventually shifted to a high rate that maintained through the election (I call this the “terminal burst”). Below I summarize key findings.
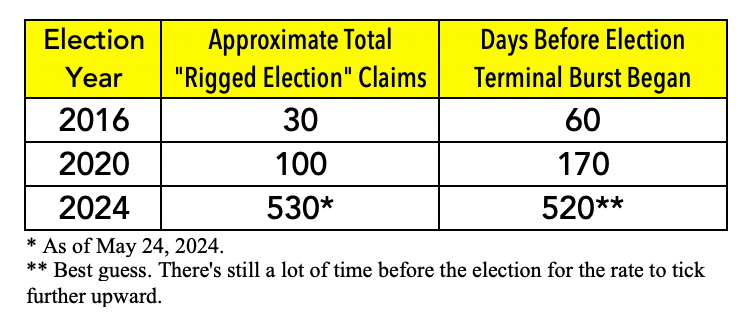
Notice how Trump has upped his game across successive elections:
• With each successive election, Trump has begun sounding his alarm earlier.
• And his overall rate is increasing. If the 2024 election were held today (more than 5 months prior to the election!), Trump would have already issued almost 18 times as many fraud claims as he did in the lead-up to 2016’s election. Clearly, by the time early November rolls around the number will be a lot higher.
Cumulative Erosion of Faith in Democracy
As to why we see this behavior, there are two points to consider. First, the best predictor of behavior is past behavior, and Mr. Trump has a history of stretching the truth, on a variety of subjects, to burnish his image and rally his supporters. This is an objective fact, not my political opinion (see Postscript 3). Second, the explanation for this particular behavior is the same as for all high-rate behavior: It works. Part of Trump’s appeal to certain voters is his (self-promoted) reputation as an invincible winner. But of course losing an election would deflate that reputation. Trump’s recurring theme, therefore, is that in a fair election he is guaranteed to win; should he lose, well, that shows the election was rigged against him. Faulty logic aside — and U.S. voters are not exactly famous for their mastery of logic — this position pre-emptively diffuses evidence that could undermine his support among core supporters. As the Times reports, it’s a strategy that Trump has long employed:
This rhetorical strategy — heads, I win; tails, you cheated — is a beloved one for Mr. Trump that predates even his time as a presidential candidate. He called the Emmy Awards “a con game” after his television show “The Apprentice” failed to win in 2004 and 2005. And before he officially became the Republican presidential nominee in 2016, he began to float the possibility that the primary contest was, as he said, “rigged and boss controlled.”
The Times rightly points out that, although Trump obviously is focused on trying to win in 2024, this is about more than a specific election. A democratic process works only to the extent that citizens trust in it sufficiently to participate and to accept peaceful, election-driven transitions of power. There’s plenty of evidence that Trump, despite having zero objective support for his claims, is eroding that trust. As the Brookings Institution notes, an increasing proportion of Americans believe their votes don’t matter, that elections are compromised, and that there is little point in participating in elections. Oh, and we can no longer lay all of this purely at Trump’s doorstep, as other candidates are now adopting his strategy. Says Brookings:
The 2022 primary elections included several candidates running for offices at the local, state, and federal levels [who] are perpetuating the dangerous myth that the 2020 election was stolen from former President Trump and was rampant with voter fraud. The persistent re-telling of the “big lie” continues to undermine confidence in the voting process and appears to be suppressing voter turnout.
A View to a Kill, Perhaps, But What a Clear View
To sum up, what the Times article reveals is a disturbing trend toward litigating elections before they occur, at the risk of stymying the democratic process that depends on elections.
That’s a big deal, something that should not be overlooked, which is why I want to return to where we started, with the Times cumulative graph that so clearly reveals Trump’s full-bore acceleration into election denialism. Sure, using a table and a fair number of words I was able to explain the patterns that the graph conveys. But, if at all possible, you ought to track down the graph for yourself. Because the thing is that when you look at it, even if you’re one of those People Who Are Not Behavior Analysts (PWANBAs), who presumably haven’t studied graphing technologies, you don’t need any special explanation. The critical real-time trends leap off the page at you — which was always the appeal of cumulative records. I’m not sure a better way of depicting behavior change in real time has been invented.
Postscripts
(1) Full text of Skinner (1976), “Farewell my LOVELY!” (Journal of the Experimental Analysis of Behavior, 25[2], 218).
Evidently we have not long to wait for an issue of JEAB without a single cumulative record! I shall not miss the records so much as the kinds of experiments that could scarcely be reported without them. There is no point in publishing a block of sloping straight lines if the only important fact is the slope; better a point on a graph. But what has happened to the curves that were curves? What has happened to experiments where rate changed from moment to moment in interesting ways, where a cumulative record told more at a glance than could be described in a page? Straight lines and steady states are no doubt important, but something is lost when one must reach a steady state before an experiment begins. There was a special kind of orderliness in a smooth curve lasting a few minutes or at most an hour. It suggested a really extraordinary degree of control over an individual organism as it lived its life from moment to moment. Shall we never again see things as fascinating as the slight overshooting when a pigeon switches from the ratio to the interval phase of a mixed schedule, or learns to use a clock in timing a fixed interval, or “sulks” for an hour after a short bout of fixed-ratio responding injected into a long variable-ratio performance, or slowly accelerates as it raps out “just one more” large fixed ratio on a straining schedule? These “molecular” changes in probability of responding are most immediately relevant to our own daily lives. They seem to me much more useful in the interpretation and design of contingencies which bring about the kinds of changes likely to be of technological interest. There is no denying the importance of the methods and equipment which have been devised for long-sustained research, but there is also much to be said for an experiment that lasts half an hour-and for a quick and comprehensive look at the fine grain of the behavior in the cumulative curve.
(2) Regarding baseball’s home run record: As with everything baseball, it’s complicated. Babe Ruth hit 60 home runs in 1937. Roger Maris hit 61 in 1961. But according to a rate-based perspective adopted by a lot of baseball people, Maris didn’t REALLY break Ruth’s record because his baseball season, which in Ruth’s day was 154 games, had been expanded to 162 games. Thus, Ruth hit 0.3896 home runs/game and Maris hit 0.3765 homes runs/game. Also, in Maris’ first 154 games, he hit “only” 59 home runs. Lots of baseball people therefore insisted that Maris’ 61 be accompanied by an asterisk to acknowledge the difference.
What this means is that in 1998 there were really two home run chases: to see if 60 home runs could be hit in 154 or fewer games (McGwire reached that total in 141 games, Sosa in 149), and to see how many could be hit in 162 games (McGwire finished with 70, Sosa with 66). History was made again in 2001 when Barry Bonds hit 73. It’s worth noting, however, that McGwire, Sosa, and Bonds all cheated by using performance-enhancing drugs — yet somehow they aren’t given Maris’ scarlet-letter treatment by being assigned an asterisk. As I said, baseball is complicated.
(3) If Trump is talking, on any subject, there’s a decent chance he’s lying. For a while, the Times maintained a list of every falsehood Trump told, regardless of topic (paywall), but I guess the project got too big to sustain. Similarly, Trump is such a persistent prevaricator that the fact-checking site Snopes.com barely bothers to monitor him any more. Politifact has checked the veracity of 1021 of Trump claims over the years, judging only 11% as True or Mostly True.